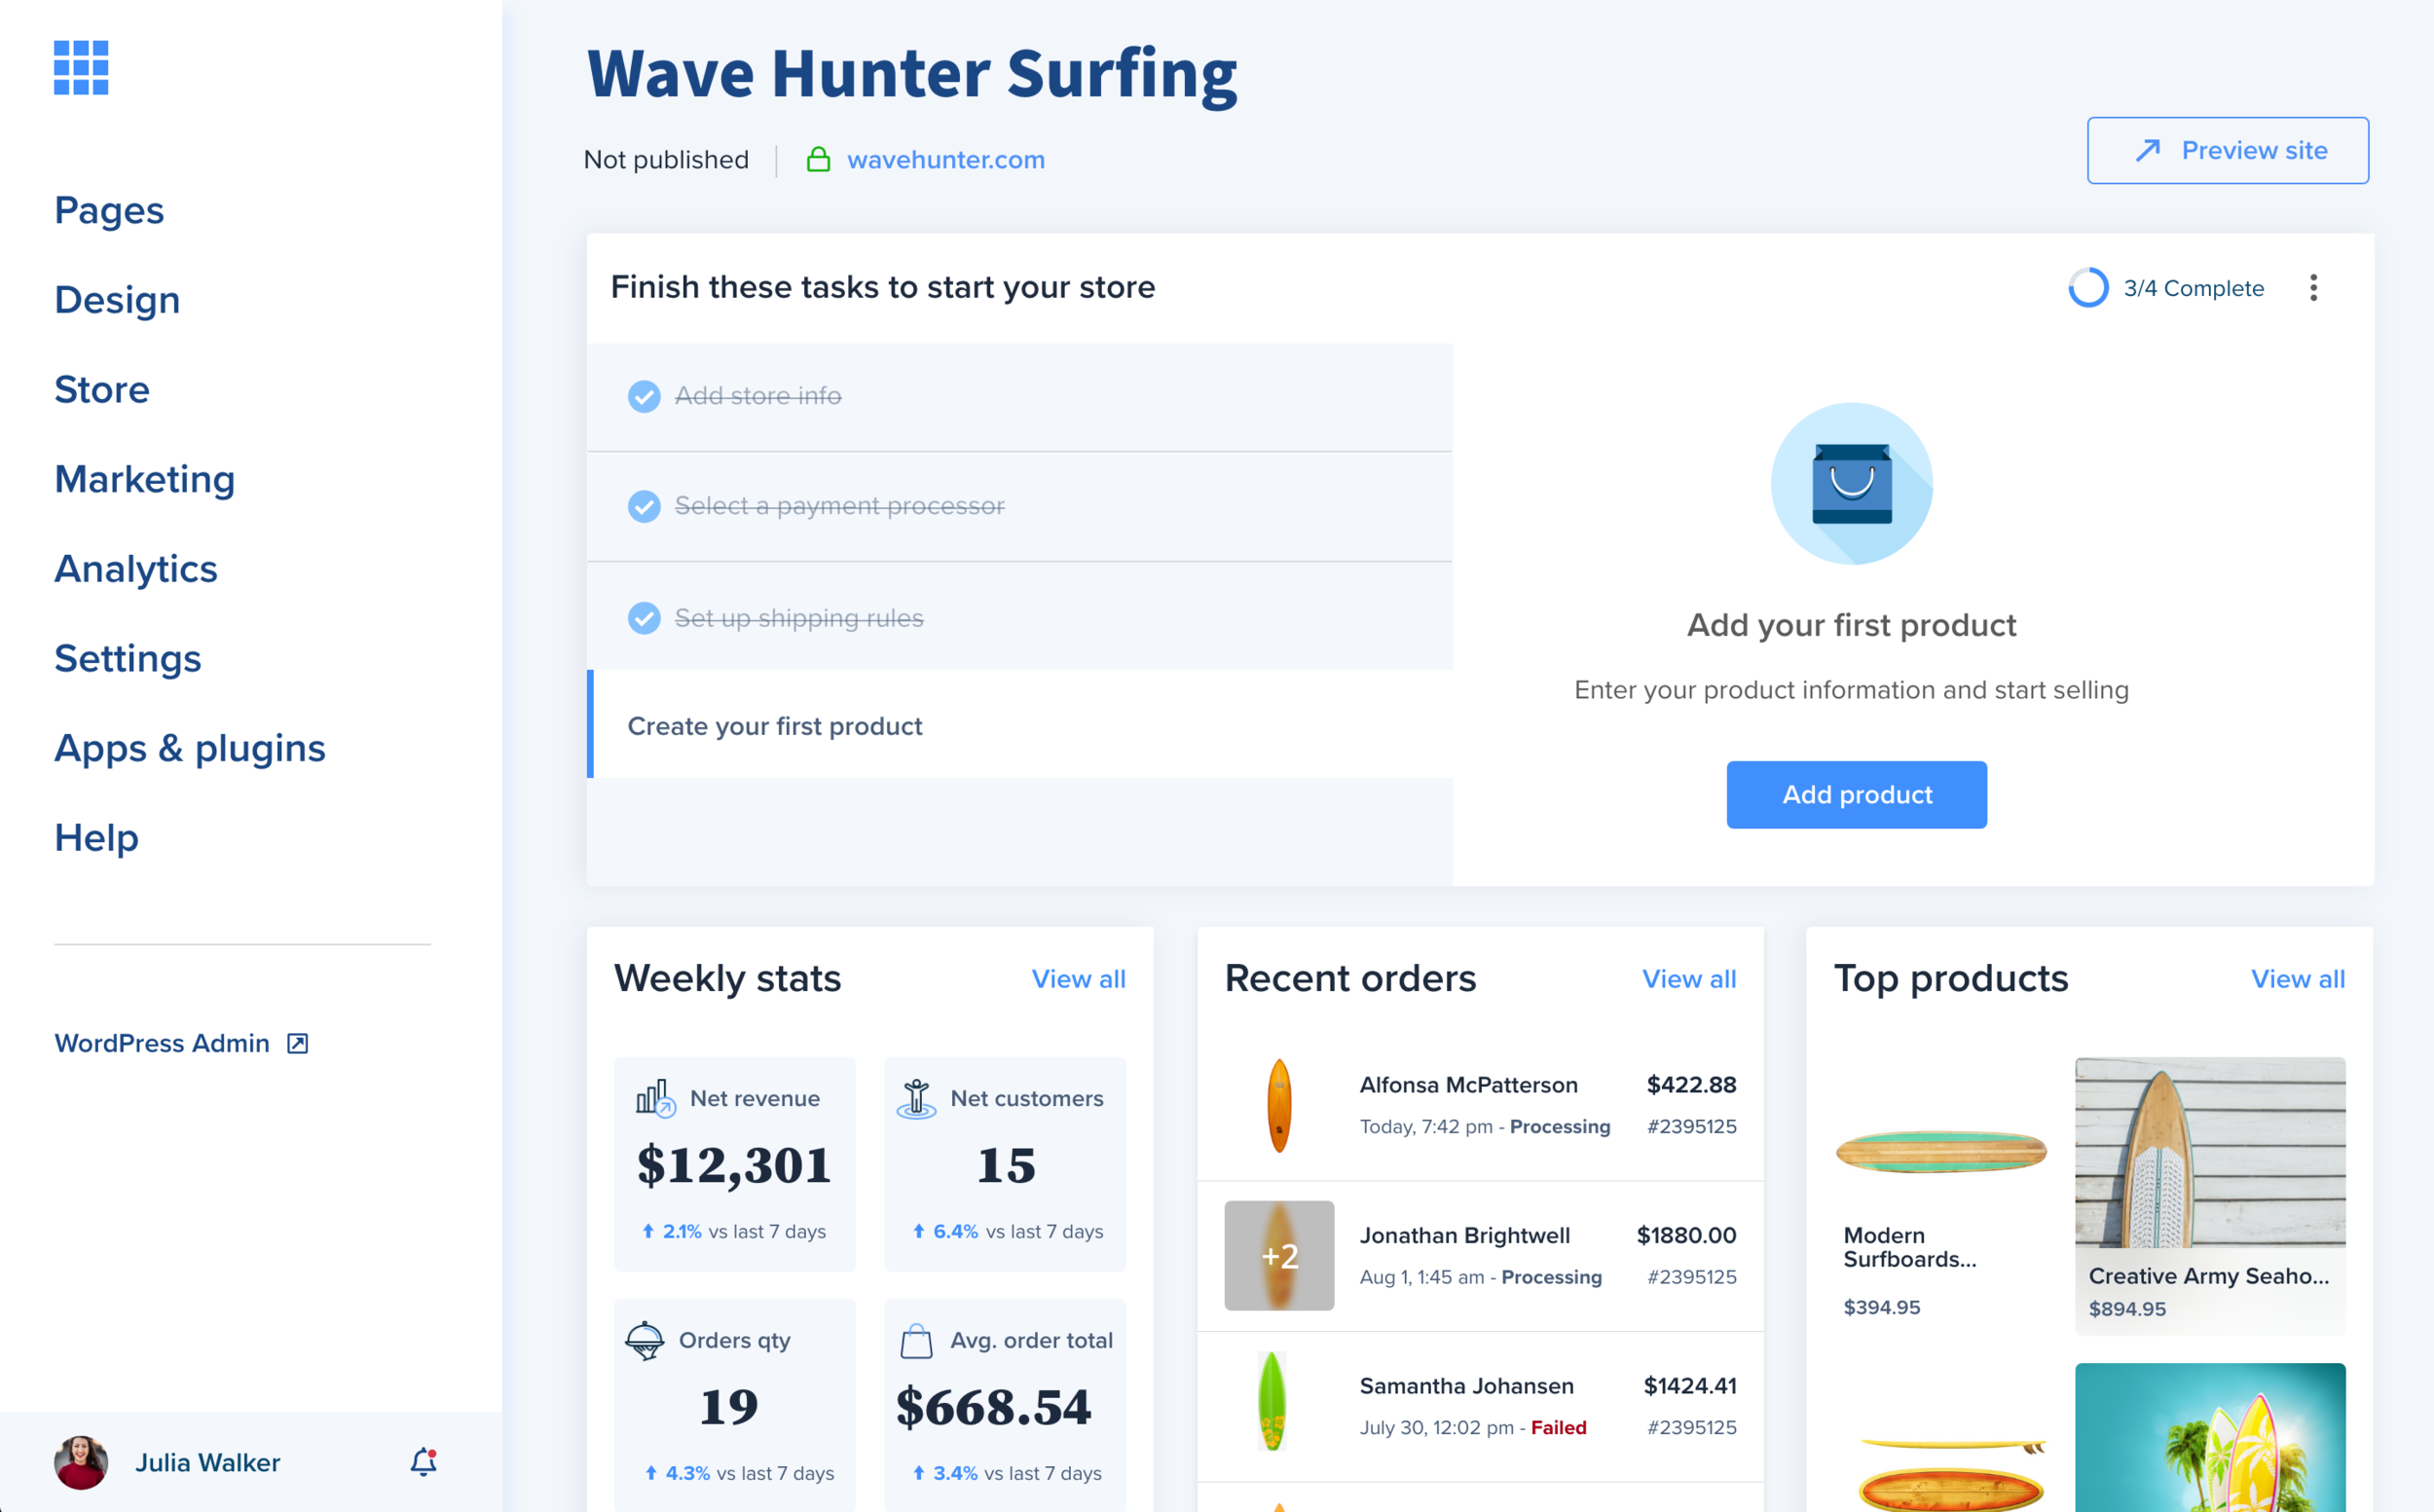
Bluehost Online Store Dashboard
Getting results through lean experiments
Our project goal was to launch experiments and validate key ideas for a new dashboard for online store customers
Customer Impact2019
Contribution
Product strategy, user research, visual design, prototyping & testing, data analysis
50% increased task completion
Solutions that increased task completion
Feature experiments:
Redesigned Onboarding Guide
Featured Products
Plugin Recommendations
Experiment 1: Simplifying the guided experience
The old version of the guided experience was not performing well for a few reasons:
Too many task options
Poor interaction and interface design
By reducing the number of available guide tasks and improving the design we believed this would result in more users engaging with and completing these tasks, which were a priority for customers trying to set up their online store.
The simplified guide performed exceedingly well. Both interaction and completion rates for these guided tasks were greatly improved.
Old guide results
New guide results
Experiment 2: Feature interest test
We have several widgets which serve our users as at-a-glance stats and information about how their site’s performance and content. Based on user research we were very content of the utility behind displaying sales statistics and recent orders, but that confidence didn’t extend to the product widget we had designed.
This is where an in-product experiment would help.
I devised a scrappy experiment that would allow us to gather data from our users without us having to go out and build a fully functional front-end with API calls and dynamic content.
The setup
In a previous product release, we introduced a feature where new installations for online store customers would include two placeholder products (seen pictured). We relied on the fact that those placeholder products would exist only during the user’s very first session.
Or experiment served up a static version of the products widget, limiting it to display only for customers during their very first session.
The results of our experiment were pretty underwhelming, so we iterated
In our experiment, we had measured user interest based on interaction, which didn’t show us promising results. The product widget didn’t perform poorly, but it didn’t quite meet our expectations.
Before throwing the idea out entirely, we decided to iterate on the design and run the test once more.
Our research had shown us that one of the primary goals a user has when they start building their online store is creating their products. Our design iteration included an “Add new product” button to our widget, which would launch users into the product creation process.
Small tweak, huge payoff
This small design iteration nearly doubled the number of interactions this element received compared to all other elements on the page and further validated our understanding of how important product creation is for our customers.
Experiment 3: Recommended plugins
In our third experiment, we wanted to validate the idea that our homepage dashboard was an appropriate place for us to surface recommended plugins from our marketplace.
We surfaced a widget showing the 6 most popular WordPress plugins for online stores on the page. We measured the conversion against users who navigated through the Bluehost marketplace to see if we could improve conversion.
The results
While we weren’t surprised to learn that this experiment would increase the rate at which users successfully installed free plugins, we were very surprised to discover that we had more than doubled conversion rates for paid plugins as well.
This helped us validate the idea that we could offer additional features and functionality to our users on the homepage.


